Risk Assessment Visualisation
This page describes the updated structure and visual components of the EUDR risk assessment results produced by OpenAtlas Vantage-X. It breaks down each part of the visualisation, explains what it shows, and how it complements the calculated results available through the API. The visualisation is produced for each plot.
The previous version of the risk assessment visualisation remains available under API version 2 for backwards compatibility, but version 2 will be decommissioned on January 31, 2026. Responses served with X-API-Version: 2 now include standard HTTP deprecation headers so you can plan migrations to version 3 ahead of the cutoff.
Vantage-X API provides a visualisation of plot temporal change between the 31st of December 2020 and the harvest date. The visualisation is available as a link under the job_visualization_url field.
General Information
The top section of the visualisation provides a summary of the overall risk score attributed to the plot of land, including:
- ID of the plot
- Location of the plot
- Area (in hectares)
- Commodity
- Risk level (
Low,Medium, orHigh) - Risk reason
- Assessment date
- Analysis cutoff (Harvest date)
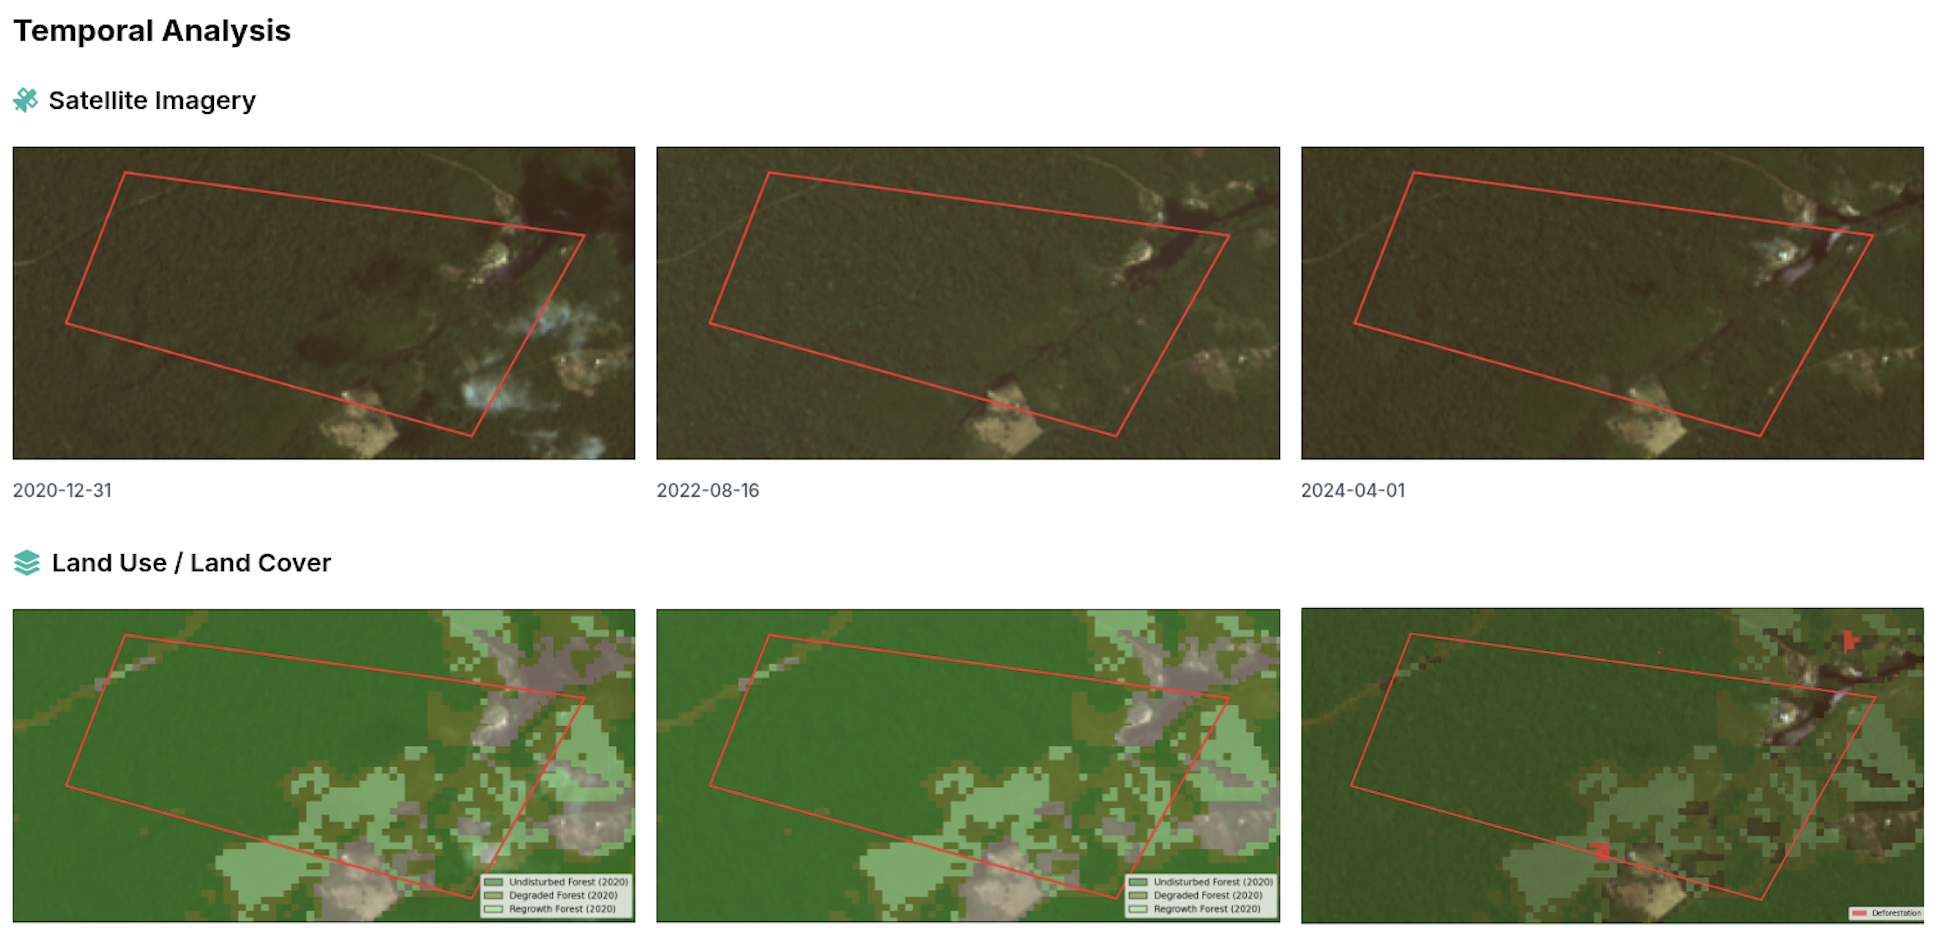
Temporal Analysis
This section includes satellite imagery and land use / land cover classes showing changes over time. It compares three time points (depending on image availability and cloud coverage):
- Start: End of 2020 (baseline)
- Middle: Approximate mid-point between baseline and harvest date
- End: Harvest date
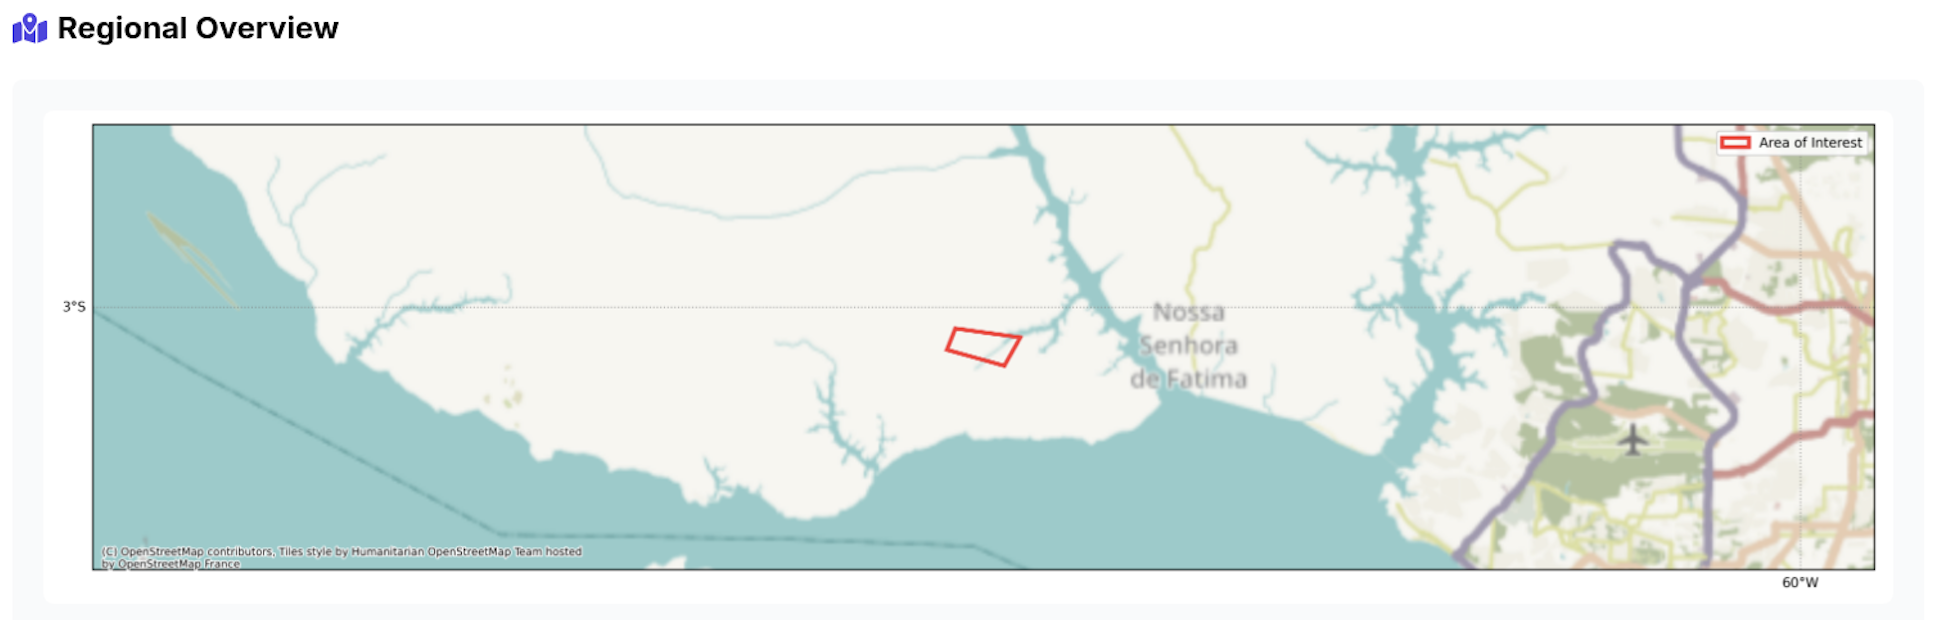
Regional Overview
This part shows the geographic context of the plot. It includes:
- A regional map
- Plot location (highlighted)
- Nearby administrative boundaries or natural features for orientation
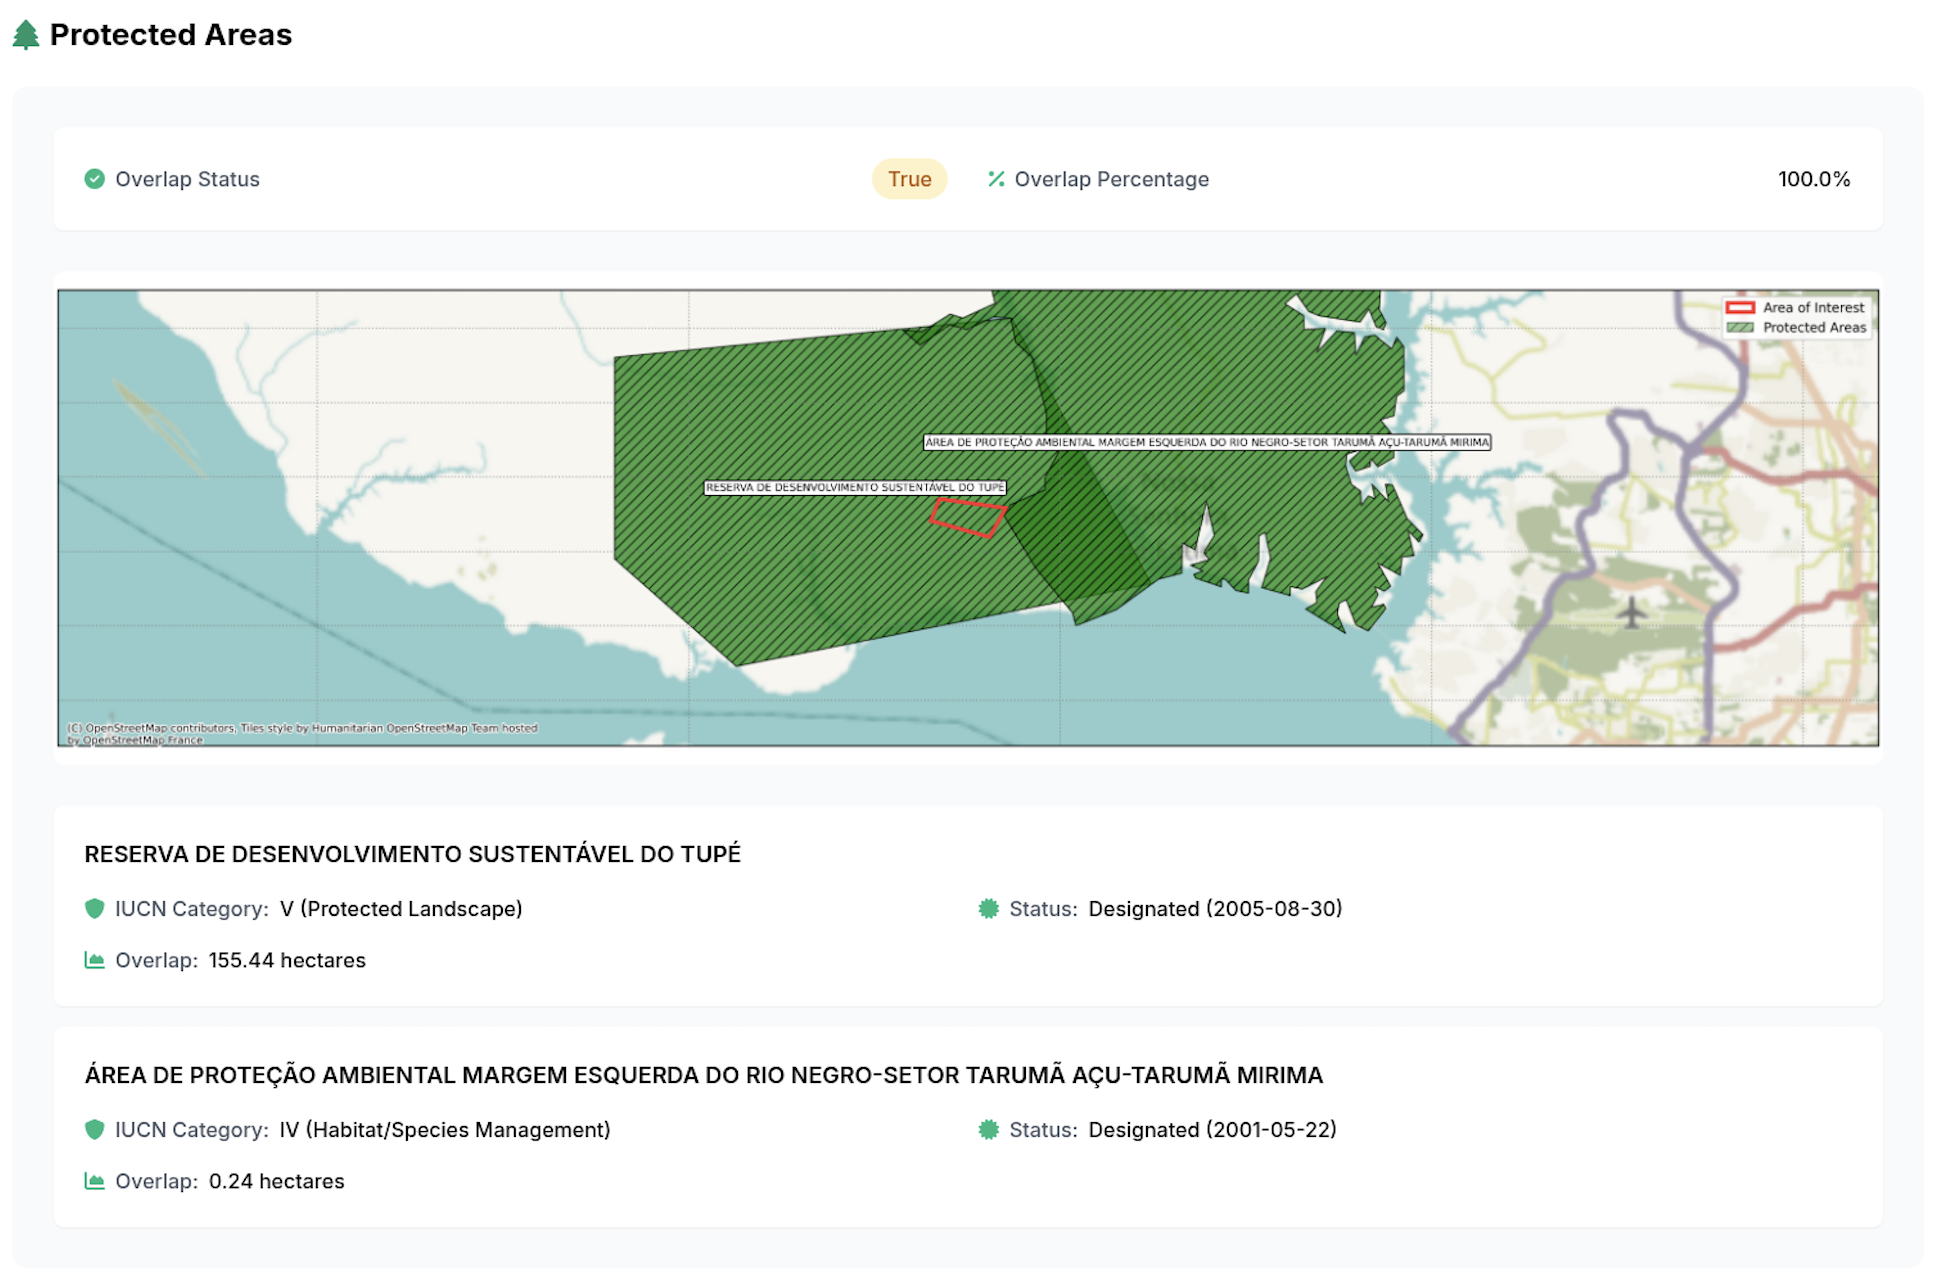
Protected Areas
This section identifies any overlaps between the plot and protected areas. More information about protected areas is in the Risk assessment guide.
It provides:
- A map with the plot and protected areas
- Area and percentage overlap statistics
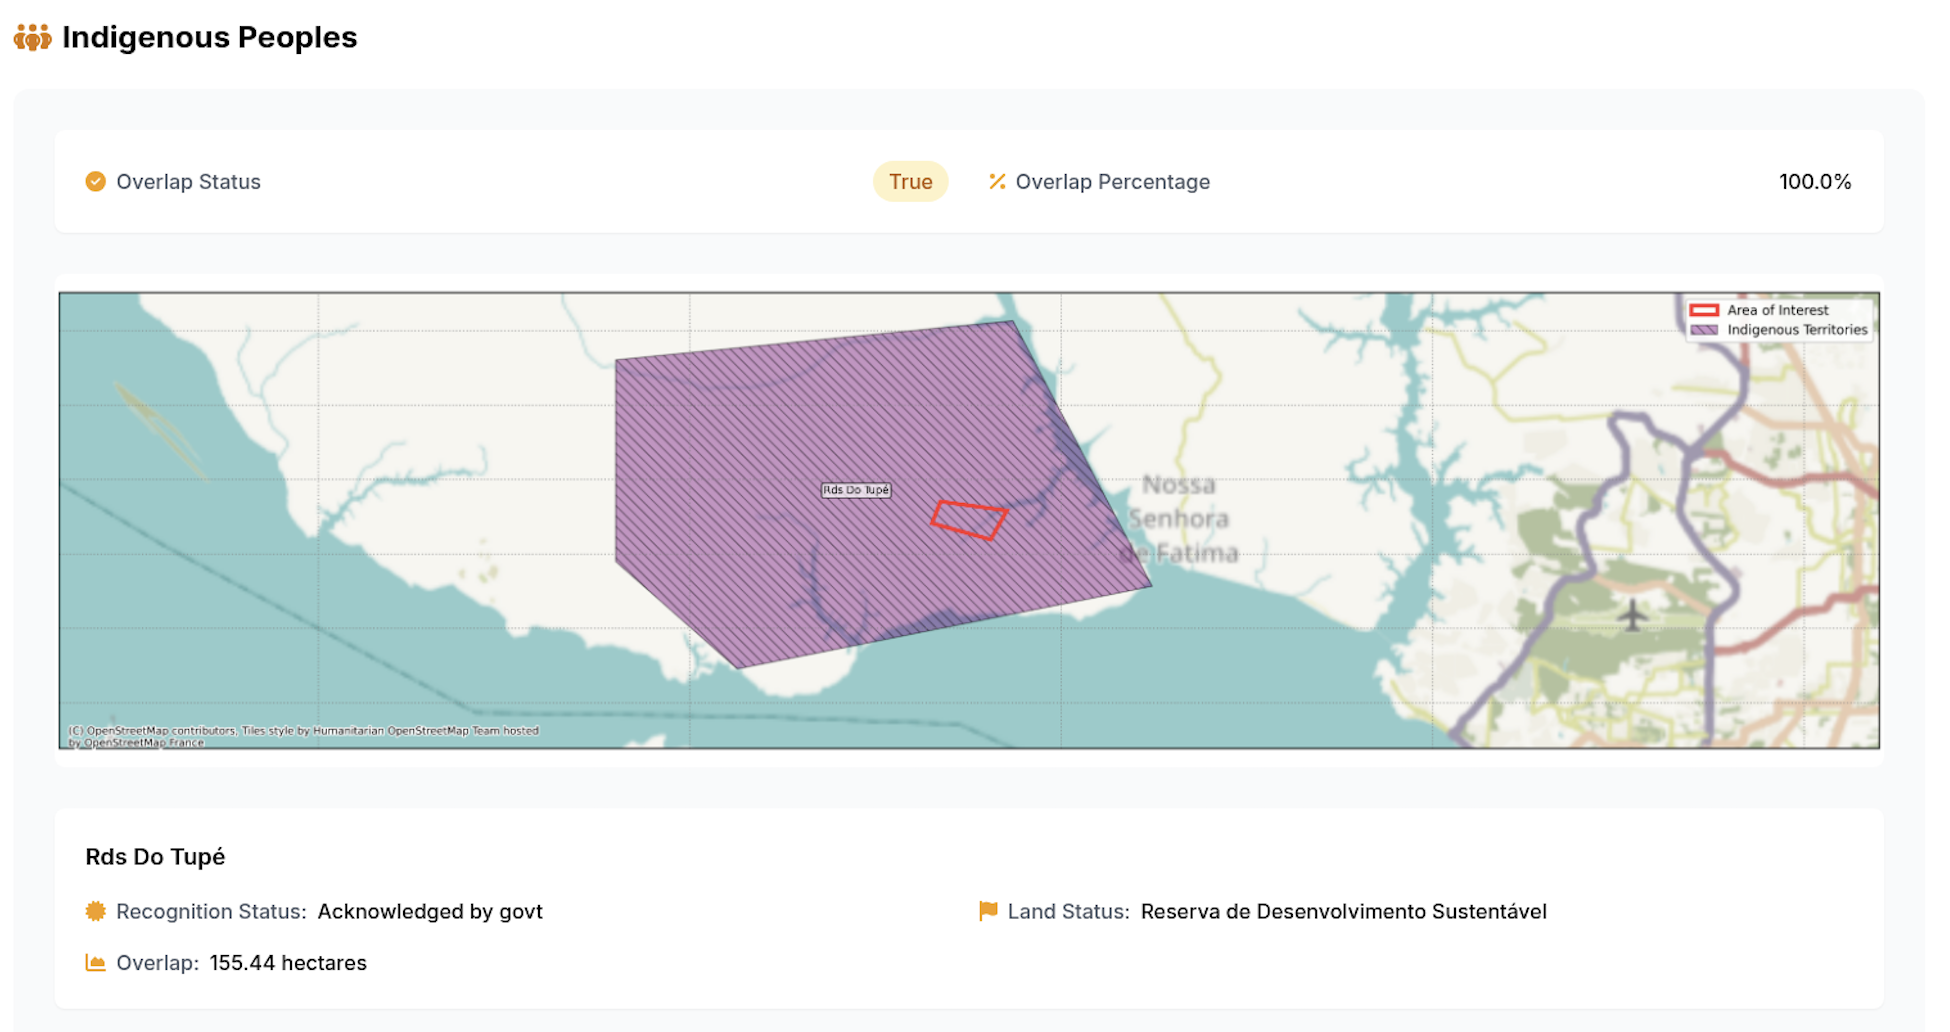
Indigenous Peoples
This view shows whether the plot intersects with land traditionally or legally recognized as belonging to Indigenous communities.
It includes:
- Map of the intersection
- Area and percentage overlap statistics
Example
You can download the full entire visualisation example here.